Get a Complete Nutrition Facts Panel from Any Food Photo
Upload any food photo and get vitamins, minerals, allergens, daily values, ingredient estimates, and a nutrient density score without any food labels.
Analyze Nutrition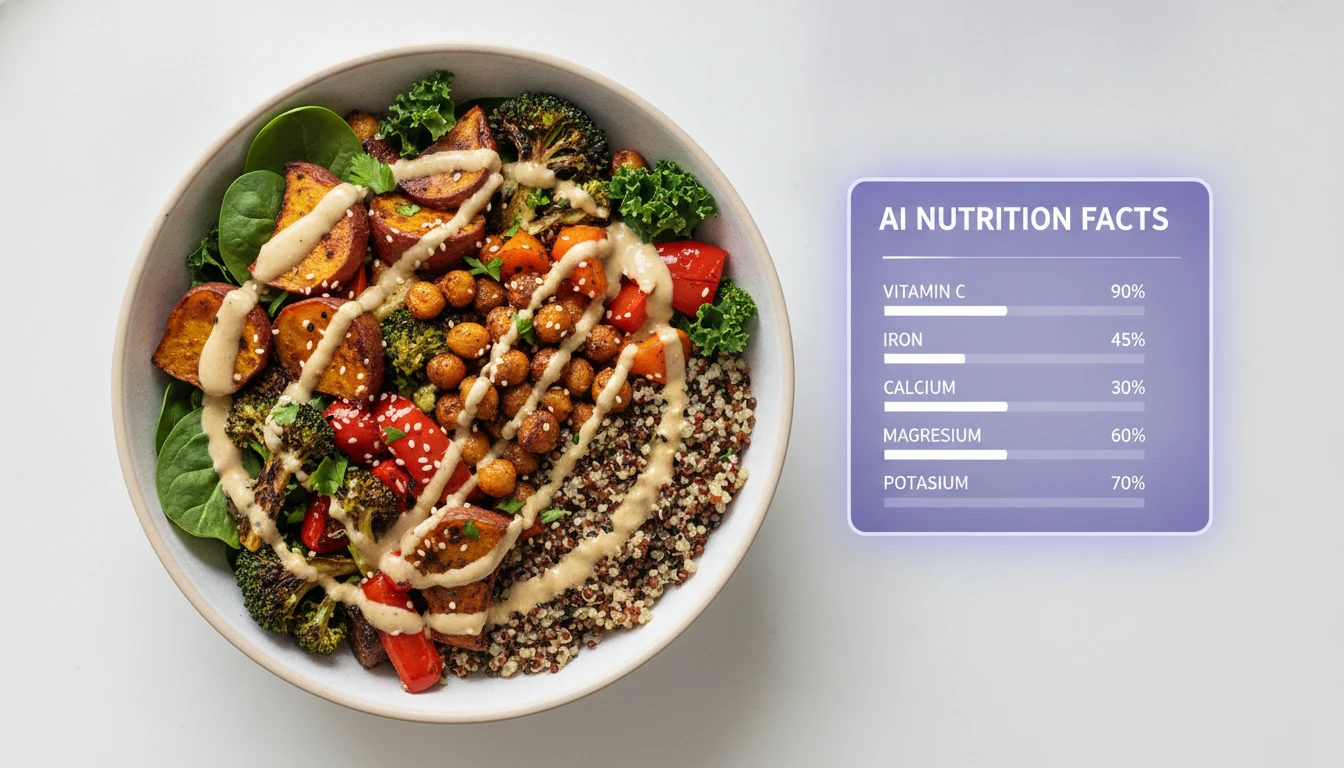
Food Nutrition Analyzer
Upload a photo of any meal and get a full nutrition facts panel covering vitamins, minerals, allergens, daily values, and ingredient estimates.
Upload a food photo
Works best with clear, well-lit photos that show the full meal.
or drag and drop an image here
Results
Food Nutrition Analyzer
Food Nutrition Analyzer
Upload a photo on the left and click analyse to see the results.
- Full nutrition facts panel
- Vitamins & minerals with % daily values
- Allergen detection
- Ingredient estimates
- Nutrient density score
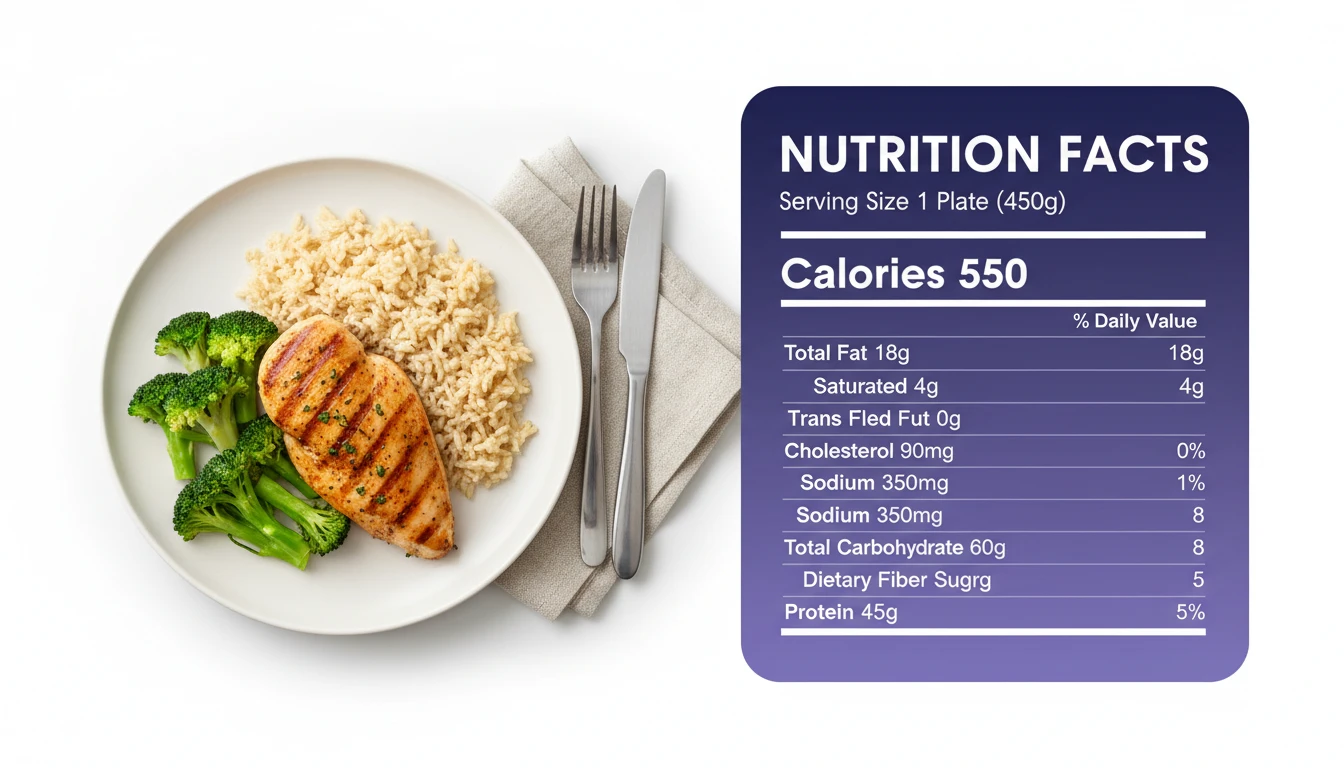
Complete Nutrition Facts Panel
Get every number from a standard nutrition label: calories, total fat, saturated fat, cholesterol, sodium, carbohydrates, fiber, sugars, and protein. All estimated from a single photo.
Get Your Nutrition Facts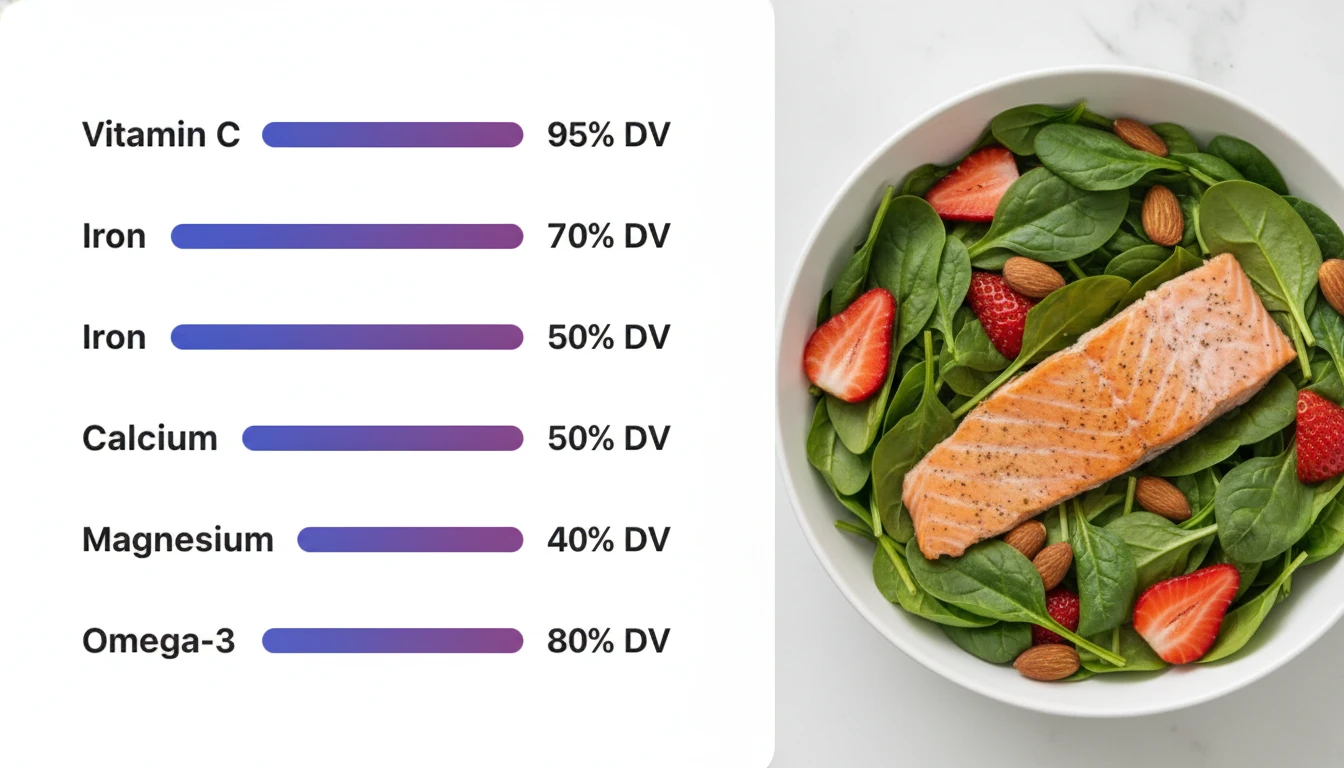
Vitamins & Minerals with Daily Values
Go beyond macros. See exactly how much Vitamin D, Calcium, Iron, Potassium, Vitamin C, Magnesium, and more your meal provides, with clear % Daily Value indicators.
Check My Vitamins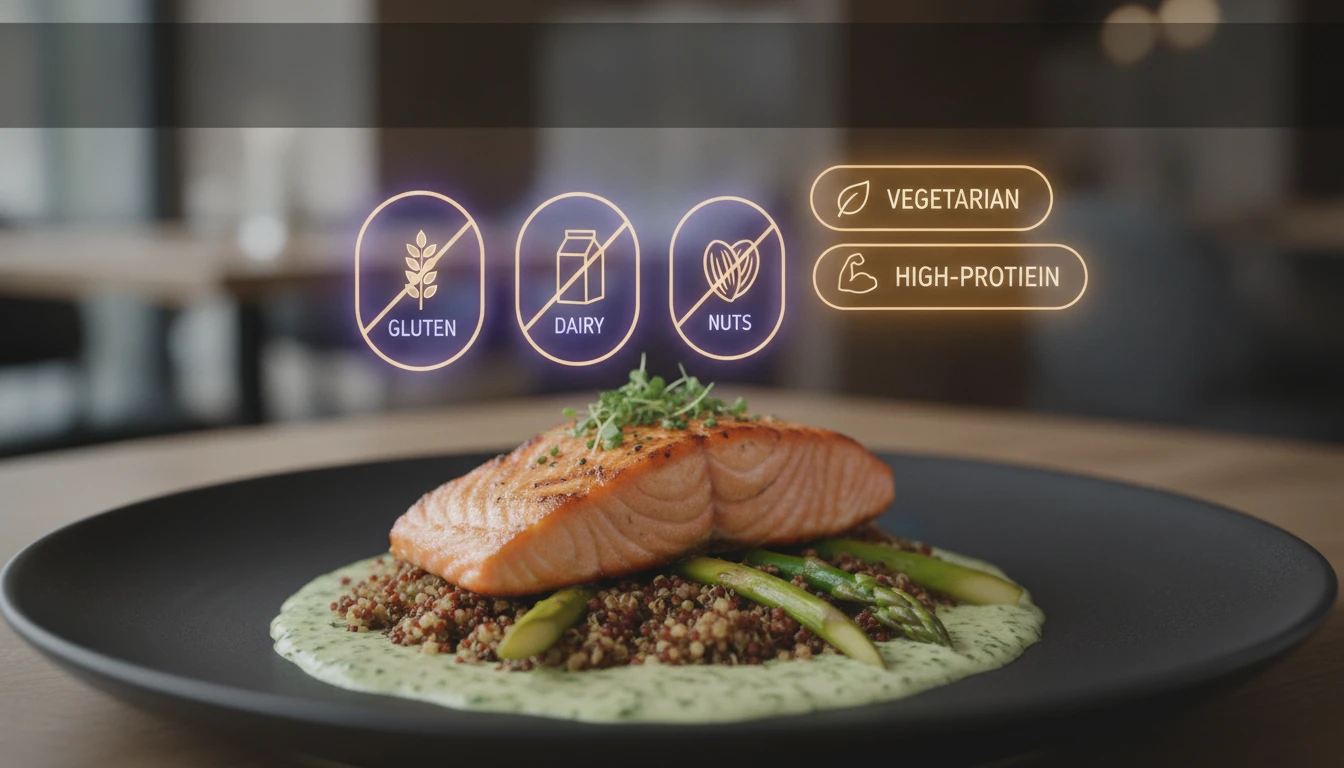
Allergen Detection & Dietary Tags
Instantly know if a meal contains gluten, dairy, nuts, eggs, soy, or shellfish. Automatically tagged with dietary labels like vegan, vegetarian, high-protein, or low-carb.
Check for AllergensHow to Analyze Food Nutrition with AI
Upload Your Food Photo
Take a clear photo of your meal or upload an existing image. Works with home-cooked dishes, restaurant meals, packaged foods, and snacks.
AI Generates Your Nutrition Label
Our AI identifies every ingredient, estimates portion sizes, and calculates a full nutrition facts panel including vitamins, minerals, and daily value percentages.
Review Your Complete Nutrition Report
View your nutrition facts, vitamin and mineral breakdown, allergen list, dietary tags, ingredient estimates, and personalized improvement suggestions.
Who Uses It

People with Food Allergies
Instantly scan restaurant dishes or unfamiliar meals for allergens before taking a bite.
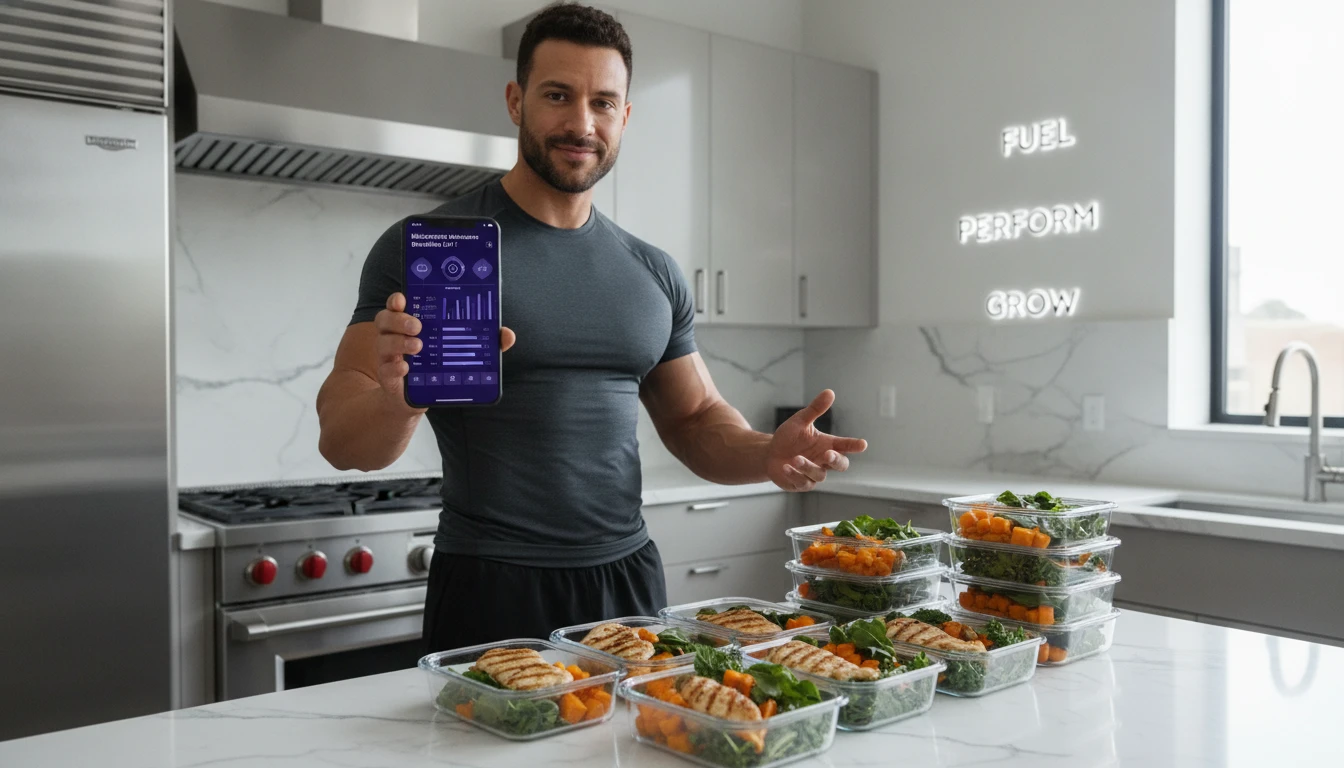
Fitness & Bodybuilding
Track micronutrient gaps, not just macros, to optimize your recovery and peak performance.

Parents & Caregivers
Ensure your family is getting the right vitamins and minerals every day, without the guesswork.
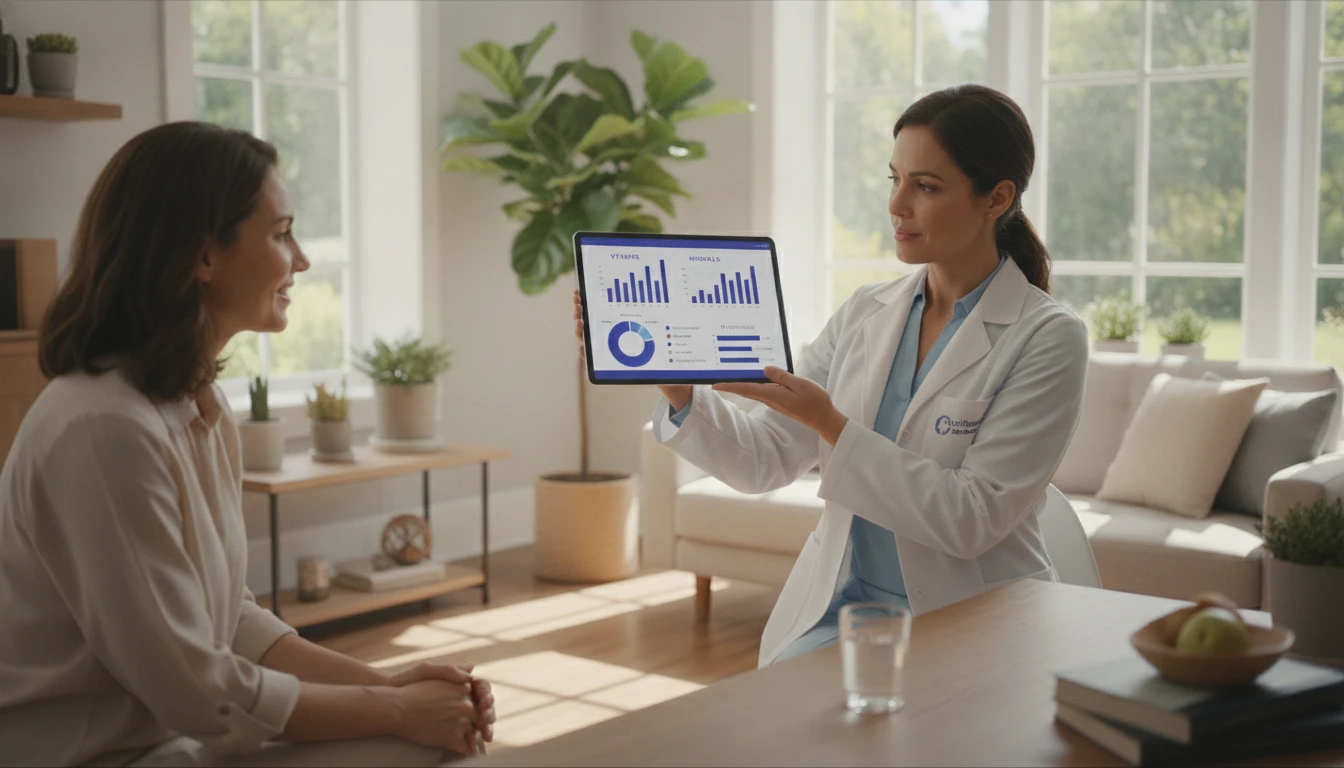
Clinical Nutritionists
Use AI-generated nutrition data as a baseline for client consultations and meal plan audits.
Deep Dive
Understanding % Daily Values
% Daily Value (% DV) tells you how much a nutrient in a serving contributes to a 2,000-calorie daily diet. Use it to quickly assess if a food is high or low in a nutrient.
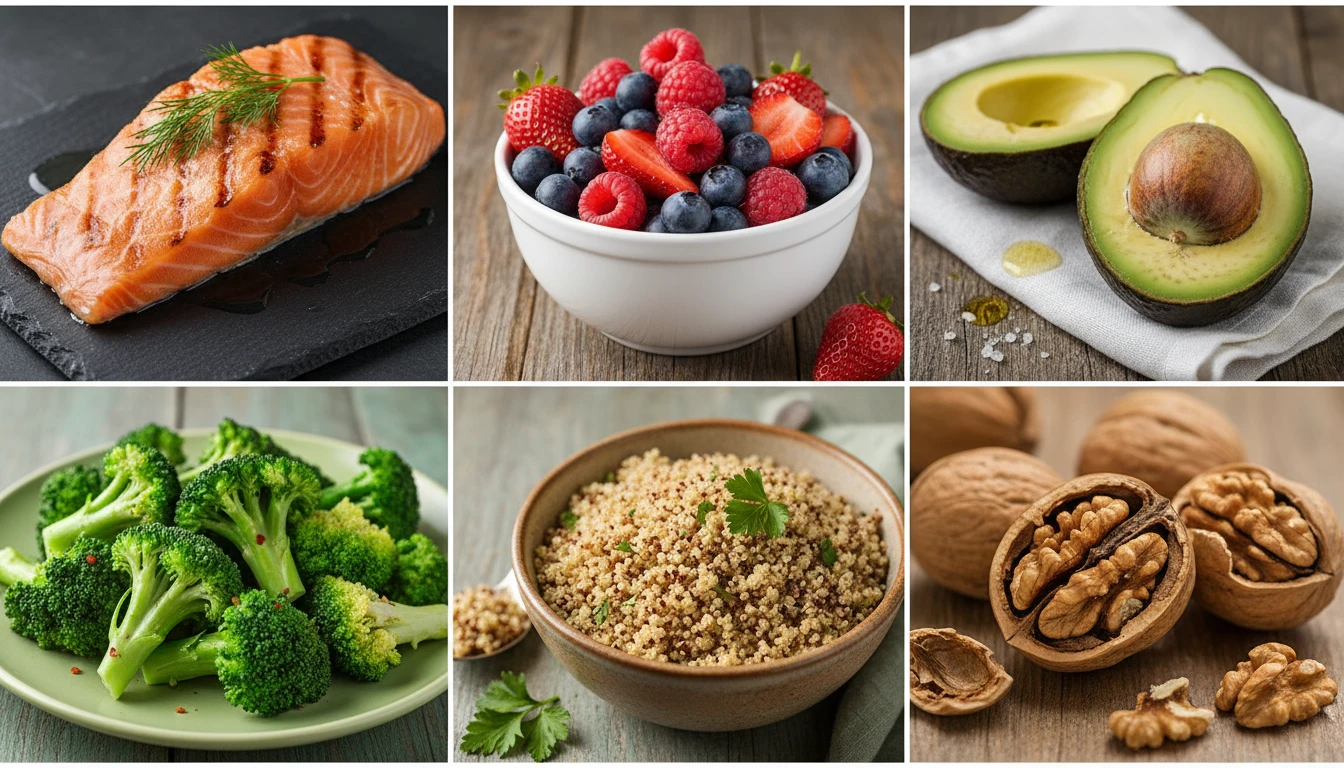
Note: % Daily Values are based on a 2,000-calorie diet. Your daily values may be higher or lower depending on your caloric needs. Consult a registered dietitian for personalized advice.
Why Use It
Deep Micronutrient Analysis
See vitamins and minerals most apps ignore, including Vitamin D, B12, Magnesium, and Potassium.
Allergen Detection
Automatically flag gluten, dairy, nuts, eggs, soy, and shellfish before you eat.
Nutrition Label Format
Results match the FDA nutrition facts format you already know, with clear % Daily Values.
Nutrient Density Score
Quickly see how many nutrients you get per calorie, not just total amounts.
Frequently Asked Questions
How is Food Nutrition Analyzer different from Food Calorie Counter?
Food Calorie Counter focuses on total calories, macros (protein, carbs, fat), health score, and meal type. Food Nutrition Analyzer goes deeper. It produces a full nutrition facts panel with vitamins and minerals and their % Daily Values, allergen detection, ingredient composition estimates, processing level assessment, and nutrient density scoring.
How accurate are the vitamin and mineral estimates?
The AI provides reasonable estimates based on known nutritional profiles of identified ingredients and estimated portion sizes. Accuracy depends on image clarity and how recognizable the food items are. Results are suitable for general nutrition awareness but not for clinical or medical decision-making.
Can it detect all food allergens?
The AI detects the major food allergens: gluten, dairy, eggs, nuts (peanuts and tree nuts), soy, fish, and shellfish. However, cross-contamination risks cannot be assessed from a photo. Always consult ingredient labels and staff for severe allergies.
What is the Nutrient Density Score?
The Nutrient Density Score (1 to 100) measures how many essential vitamins and minerals a food provides per calorie. A score of 80 or above means the food is packed with nutrients relative to its calorie content, like leafy greens or fish. A score below 30 suggests the food is calorie-dense but nutrient-poor.
What does Processing Level mean?
"Minimally Processed" foods are close to their natural state (fruits, vegetables, plain meats). "Moderately Processed" foods have been altered but retain most nutrients (canned beans, cheese, bread). "Ultra-Processed" foods contain many additives, preservatives, or artificial ingredients (fast food, packaged snacks).
Get Your Full Nutrition Facts Instantly
Sign up free and get 100 credits instantly. Analyze any meal and see the vitamins, minerals, allergens, and daily values. All from a single photo.
Disclaimer: This tool uses generative AI technology which may produce content that resembles copyrighted materials or that is inaccurate, incomplete, or out-of-date. It is provided for general information and educational purposes only and is not intended for illegal activities or to replace professional advice, diagnosis, or treatment. Users are solely responsible for how they use the generated content. If you plan to use AI-generated content commercially or publicly, we strongly recommend reviewing it for potential copyright issues and obtaining proper permissions where necessary. We accept no liability for copyright infringement or any other consequences resulting from the use of content generated by this tool.